
As of November 2, 2026, the 10-year Treasury yield is about 4.9%.* The 10-year Treasury is a government bond that matures in ten years, and its yield is the number most often quoted. A Treasury yield is the annual return you earn if you buy a U.S. Treasury at today's price and hold it until it matures. That sits below the 5.80% average since 1962* and well above the roughly 3.2% average of the last 25 years, by our calculation.**
Both individual Treasuries and bond ETFs, which are funds that hold many bonds and trade on a stock exchange, can hold the same U.S. government debt. What differs is what each one promises, and which promise fits depends on the person. Below, we cover where today's yield sits in 40 years of history, how the two options work, and how we at Three Sixty think through the choice.
Is a 5% Treasury Yield Normal? A Look at 40 Years
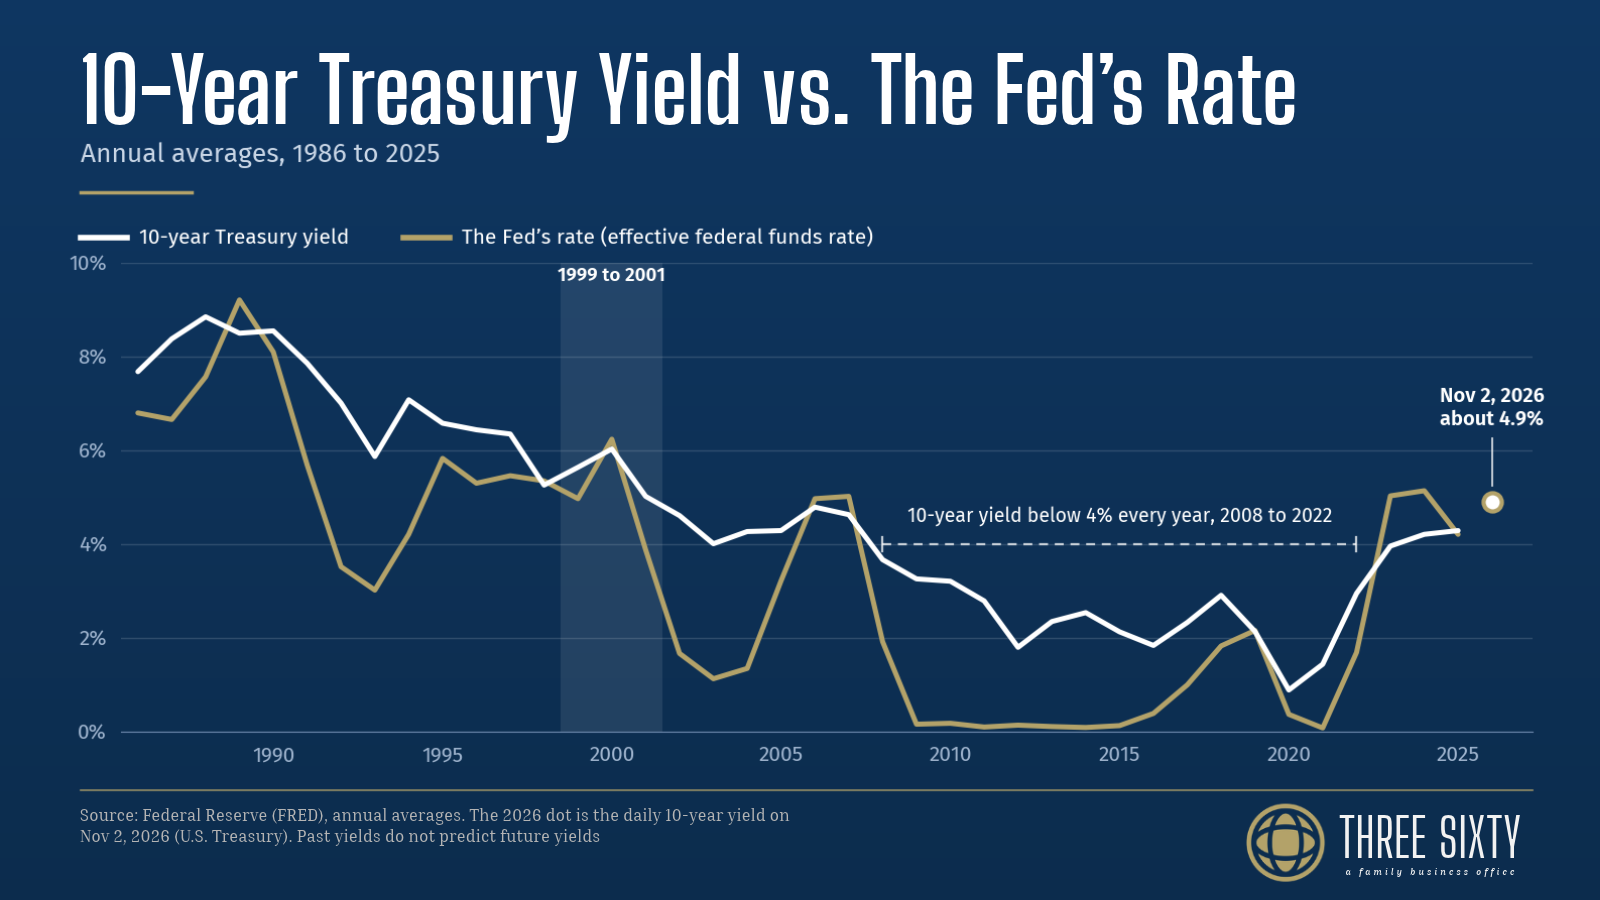
It depends on which years you compare. Averaging the 10-year Treasury yield for each year from 1986 through 2025 gives about 4.7%,** so today's 4.9% sits a little above the 40-year average. That average hides two very different stretches: about 7.1% from 1986 to 2000, and about 3.2% from 2001 to 2025.** A 5% yield looks low next to the 1990s and high next to the 2010s.
1986 to 2000: Higher Yields and a Turning Point in 1999
Through the late 1980s and 1990s, the annual average stayed between about 5% and 9%. The peak came earlier, when the 10-year yield hit 15.84% on September 30, 1981,* as the Federal Reserve moved to bring inflation down.***
The years 1999 to 2001 show how quickly conditions can change. The Fed raised its rate six times between June 1999 and May 2000, from 4.75% to 6.50%.*** At the time, unemployment was near 4% and inflation was edging toward the Fed's 2% target.*** In 2000, the Fed's own rate averaged 6.24%, a little above the 10-year yield's 6.03%.** When the Fed's rate climbs above what the 10-year pays, investors often take it as a sign that growth may slow.
It did. The dot-com stock bubble burst, a recession ran from March to November 2001,*** and the Fed cut its rate 11 times that year, from 6.50% to 1.75%.*** The 10-year yield averaged 5.02% in 2001.**
2001 to 2021: A Long Decline
From 2001 on, yields mostly drifted lower. The annual average fell to 3.67% in 2008, the year of the financial crisis, then 1.80% in 2012, and 0.89% in 2020, the lowest year on our chart.** The Fed's own rate averaged under 0.4% in both 2009 and 2020.** When investors worry about the economy, they tend to buy Treasuries as a safe place for money, which pushes yields down.
That pattern is part of why we hold bonds at all. In both the early 2000s and 2008, yields fell as stocks and the economy struggled, which means Treasury prices rose. Smoothing out the ups and downs is the job we give bonds in a portfolio.
For fifteen straight years, from 2008 through 2022, the annual average never reached 4%.** An investor who started after 2008 has spent most of their time with yields well below today's.
2022 to Today: Back Near 5%
Inflation rose after 2021, and the Fed responded with a series of rate increases. The annual average yield climbed from 1.44% in 2021 to 4.21% in 2024.** Bloomberg reported that the 10-year yield crossed 5% in mid-September 2026 for the first time since 2023, and it reached its highest level in 24 years in early October.**** It has since eased to about 4.9%.* On September 16, the Fed raised its own rate to a range of 3.75% to 4.00%.****
Several forces are behind the move. Bureau of Labor Statistics data show prices rose 3.7% over the 12 months ending in September.**** Heavy borrowing is another factor. The Congressional Budget Office projects a federal deficit of about $1.9 trillion for fiscal 2026. Goldman Sachs estimates companies have sold about $489 billion of bonds tied to AI spending so far this year.**** More bonds for sale tends to push prices down and yields up.
Rising yields have a cost for anyone already holding bonds, because prices fall as yields rise. What we tell clients in that situation does not change: the price moved because interest rates moved, and the fund's yield is expected to adjust upward as it replaces older bonds.
A yield near 5% means new buyers can lock in more income than they could for most of the last 15 years. It also reflects higher inflation and heavy borrowing, so a high yield is not automatically good news. At Three Sixty, a yield near 5% does not settle whether a Treasury belongs in someone's portfolio. That depends on the person, as the last section explains.
How Individual Treasuries and Bond ETFs Differ
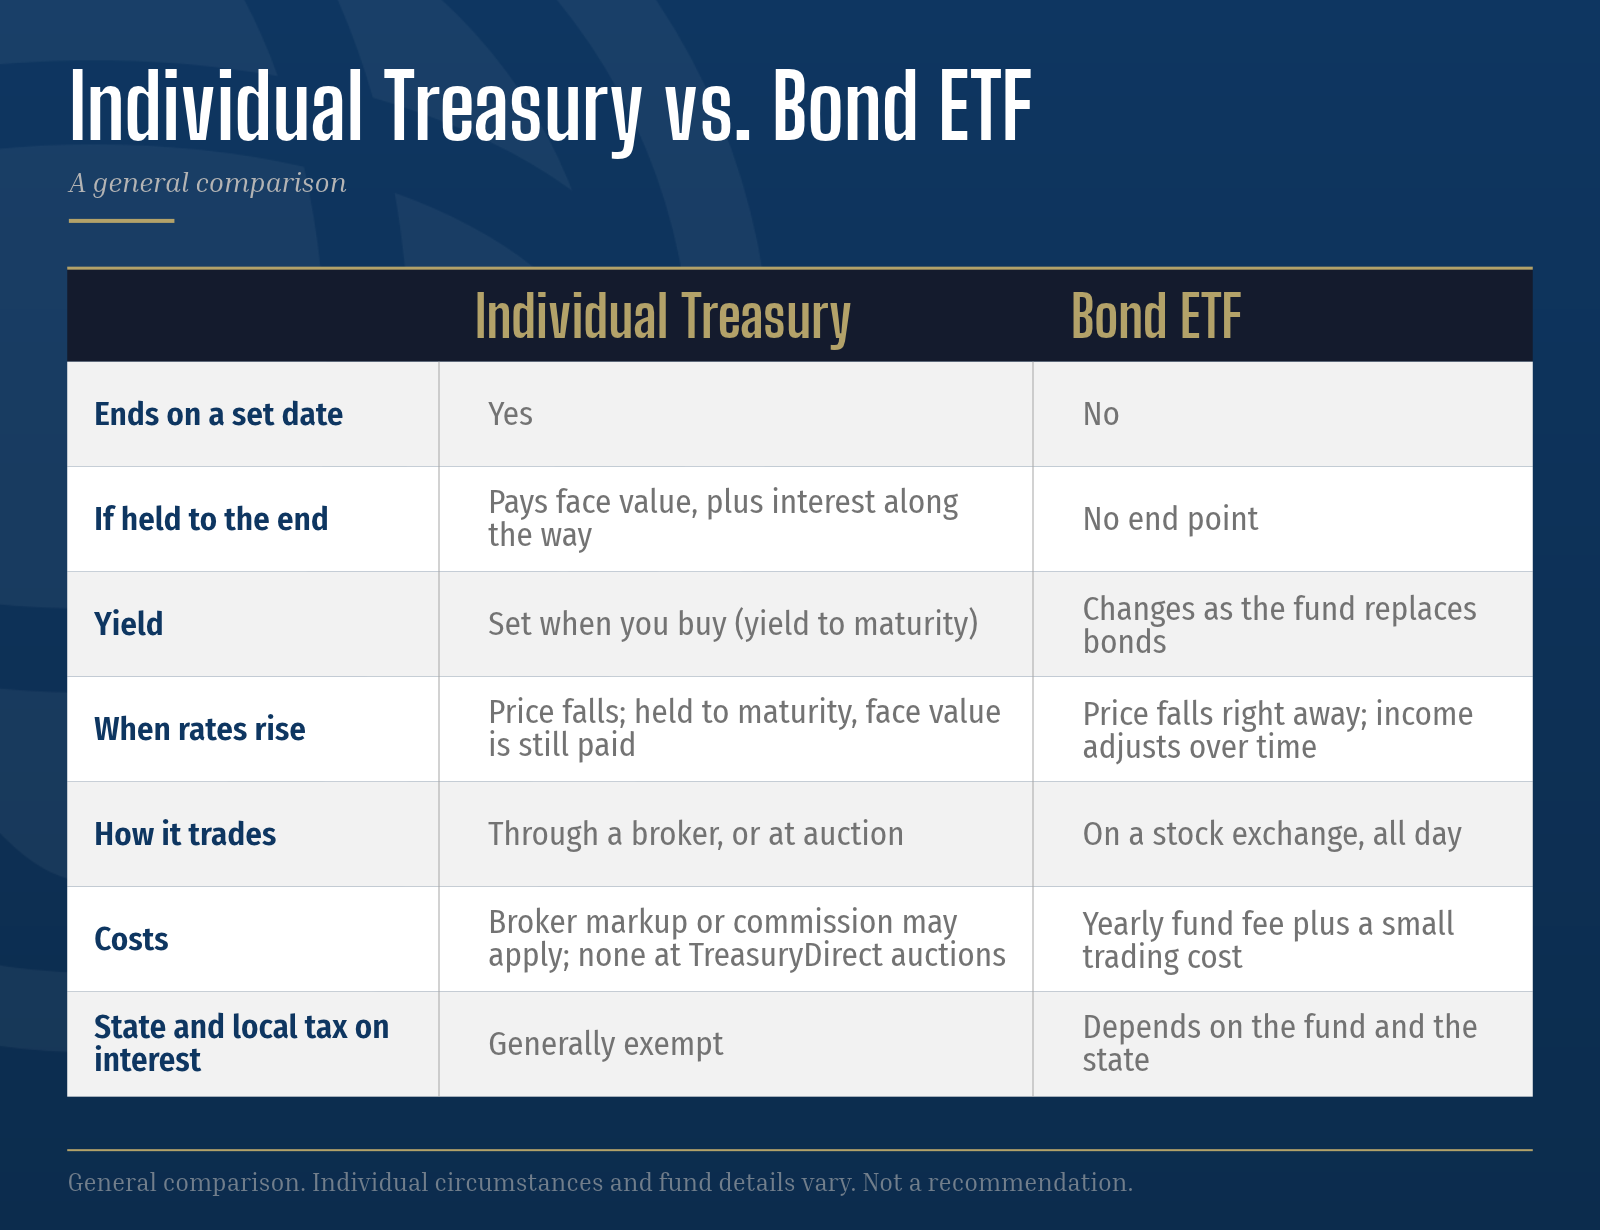
An individual Treasury pays set interest and returns its face value on a set date. A bond ETF holds many bonds, has no end date, and keeps replacing what it owns. Both can hold the same U.S. government debt, so the difference comes from what each one promises.
A Treasury Promises a Date and an Amount
A Treasury note or bond pays interest every six months and returns its face value, the amount printed on it, on its maturity date.***** The U.S. government backs those payments, so the risk of default is very low. If you hold the Treasury until it matures, you receive the face value no matter what happened to its price in between. If you sell before then, you get the market price that day, which may be higher or lower than what you paid.
Some investors buy several Treasuries that mature in different years, which is called a ladder. With one Treasury coming due each year for five years, cash arrives on a schedule, and each maturing Treasury can be spent or reinvested at whatever yields are available at that point. We have used ladders for clients before.
A Bond ETF Keeps Rolling
A bond ETF, short for exchange-traded fund, holds many bonds in one fund and trades on a stock exchange throughout the day. It never matures. As the bonds inside it come due, the fund replaces them with newer ones at current yields, so the income it pays changes over time.
When interest rates rise, the price of the fund drops right away, and the higher yields arrive gradually as the fund buys new bonds. The size of the drop depends on how long the bonds are. A half-point rise in yields can lower the price of a fund holding bonds 20 years or longer by roughly 7%, while a fund holding shorter-term bonds moves far less.******
A fund can also quote its yield in more than one way. One large long-term Treasury fund's website listed about 5.4% for the past 30 days and about 4.9% for the past 12 months. It also listed about 5.6% as the average yield if each bond were held to maturity.****** The numbers differ because each one measures something different: recent income, last year's income, or what the bonds would pay if held until they mature.
Reading a Treasury's Price: Premium, Discount, and Liquidity
A Treasury bought after it was first issued can cost more or less than its face value. Paying less is called buying at a discount, and paying more is called buying at a premium. Which one applies depends on the interest rate printed on the Treasury compared with what new Treasuries pay today, and when rates rise, older Treasuries with lower interest rates trade at a discount.
Here is a hypothetical example, based on our calculation. Take a Treasury with two years left and a face value of $1,000. If new Treasuries pay 5%, one with a 3% interest rate would sell for about $962, and one with a 6% interest rate would sell for about $1,019. Both prices move toward $1,000 as the maturity date gets closer. The interest rate printed on a Treasury is the wrong number to compare. The yield to maturity, the total annual return if you hold it until it matures, accounts for the price you pay.
Liquidity is how easily an investment can be turned into cash. Treasuries trade in one of the largest bond markets in the world, and funds trade all day, so either one can be sold on any business day. What differs is certainty. A Treasury held to maturity has a known payoff, while a Treasury sold early, or a fund sold at any time, brings whatever the market price is that day. Costs differ as well. A fund charges a yearly fee. Buying an existing Treasury through a broker can include a markup, while TreasuryDirect, the government's own website, lets investors buy new Treasuries without commissions.*****
How We Weigh the Choice at Three Sixty
When a client asks whether a Treasury makes sense, we start with whether it suits that person. Suitability rests on four things: allocation, liquidity, risk tolerance, and the goal for the money.
Suitability Comes First
Allocation is how much of a portfolio sits in bonds and what kinds. Liquidity is when the client might need the money. Risk tolerance is how much price movement the client can accept without changing course. The goal is what the money is for, such as income in retirement or a purchase five years out. Asked whether now is a good time to buy Treasuries, our answer is usually "it depends," and those four things are what it depends on.
Treasuries carry very little risk of default, and bond ETFs give us more options in how a bond allocation is built.
How We Build Bond Holdings
Our standard approach is to hold bond ETFs in three groups. Core funds make up the main part of the bond allocation. Short duration funds own bonds that come due sooner, so their prices move less when rates change. International funds own bonds issued outside the United States. Individual Treasuries are usually one-off purchases, made when a Treasury is suitable for a client or when a client wants to own one.
Where a Treasury is held matters somewhat. Interest on Treasuries is generally exempt from state and local income tax,***** so a taxable account is a better home for them than an IRA, where that benefit generally goes unused. This is one factor in asset location, which is the choice of which investments go in which accounts. It ranks below other factors, such as how each account type is taxed overall.
When Prices Fall After Rates Rise
As noted above, bond prices fall when rates rise, and that can show up on a statement as a loss. A price drop caused by rising rates does not, by itself, lead us to sell or reduce the holding. We expect the fund's yield to adjust over time as it replaces older bonds with newer, higher-yielding ones. That is an expectation, not a guarantee, and prices could fall further if rates keep rising before the higher yields catch up.
Frequently Asked Questions
It depends on the years you compare. The 10-year Treasury yield averaged about 4.7% from 1986 through 2025, about 7.1% from 1986 to 2000, and about 3.2% from 2001 to 2025, based on our calculation from Federal Reserve data.** At roughly 4.9% on November 2, 2026,* today's yield is below the first stretch and above the second.
Neither is better in every case. An individual Treasury returns its face value on a set date if held to maturity. A bond ETF has no end date but gives more flexibility in how much to hold and what kinds of bonds to own. Allocation, liquidity, risk tolerance, and the goal for the money decide which fits.
Yes, if you sell before maturity for less than you paid, which can happen after interest rates rise. If you hold a Treasury until it matures, the government pays the interest and returns the face value, which is less than the price paid if you bought at a premium. Inflation can also reduce what that money buys.
It depends on whether a Treasury suits the investor. Yields near 5% let new buyers lock in more income than they could for most of the last 15 years, but prices can still fall if rates rise further. Allocation, liquidity, risk tolerance, and the goal for the money decide whether it fits.
The 10-year yield hit 15.84% on September 30, 1981,* and averaged as low as 0.89% for all of 2020.** At about 4.9% today, it sits between those two, and which Treasury or fund fits depends on the person it is for and when that money will be needed.
* Treasury yield data: U.S. Department of the Treasury, Interest Rate Statistics. Macrotrends, 10-Year Treasury Yield (1962 to 2026).
** Annual averages: Federal Reserve Bank of St. Louis (FRED), 10-year Treasury yield and federal funds rate. Averages and other calculations are Three Sixty's own.
*** Federal Reserve rate history and recession dates: Bankrate. Forbes Advisor. National Bureau of Economic Research.
**** 2026 rates, inflation, and borrowing: Federal Reserve press release, September 16, 2026. Bloomberg, September 14, 2026. Forbes, October 7, 2026. Bureau of Labor Statistics, Consumer Price Index.
***** Treasury facts: TreasuryDirect, Treasury Bonds. TreasuryDirect, FAQ. Britannica Money, TreasuryDirect.
****** Bond fund data: 24/7 Wall St., October 19, 2026. BlackRock iShares, fund data as of mid-October 2026.
This content reflects market conditions, economic data, and other information available as of the date of publication. Economic conditions, market data, Federal Reserve actions, and other relevant factors are subject to change without notice. Any forward-looking statements, forecasts, probability estimates, or opinions expressed herein are based on assumptions and information available at the time of publication and may not reflect actual outcomes. The information provided is for informational purposes only and should not be relied upon as current after the publication date. The firm undertakes no obligation to update, revise, or supplement this content to reflect subsequent events, changes in market conditions, or the occurrence of anticipated or unanticipated developments, even if the information becomes inaccurate or incomplete.
No client or potential client should assume that any information presented or made available on or through this blog should be construed as personalized financial planning or investment advice. Personalized financial planning and investment advice can only be rendered after engagement of the firm for services, execution of the required documentation, and receipt of required disclosures. Please contact the firm for further information.
Advisory services offered through Three Sixty FBO, LLC an SEC registered Investment Advisor. Registration with the SEC does not imply a certain level of skill or expertise. Additional information about Three Sixty FBO, LLC is available in its current disclosure documents, Form ADV, Form ADV Part 2A Brochure, and Client Relationship Summary report which are accessible online via the SEC's investment Adviser Public Disclosure (IAPD) database at adviserinfo.sec.gov/firm/summary/301007. Three Sixty FBO, LLC does not offer or provide legal advice. Please consult your attorney for such services.